

The primary goal for information managers is to provide the information their internal users need to meet their research objectives. As renewal season nears, information managers face the challenge of how to justify their content investment portfolio to internal budget decision makers amidst a potentially shrinking budget. Information managers find themselves asking these two questions:
- How can usage data tell the story of what resources are being used by researchers?
- How can that usage data validate the need for subscriptions?
The answer to these questions can be found in COUNTER publisher subscription usage data, which can demonstrate the strategic value of content for your organization when interpreted correctly.
How Can Usage Data Justify Spend?
A powerful way to justify spend for subscriptions is through rich data visualizations that highlight what content is being used. Using publisher COUNTER statistics, it’s possible to look at total usage for a certain journal or eBook so far during the year, as well as historic usage from the previous year. Turning those aggregated totals into visualizations provides an easy-to-understand view of what publications are being used most heavily.
These visualizations are valuable tools for information managers to have available when budget for subscribed content is on the chopping block, especially when those publications and their associated usage can be compared with document delivery costs for that content to show the monetary value of a subscription.
To really drive home the importance of a resource, creating a year-over-year view of journal or eBook usage validates the strategic importance of subscriptions and provides insight into how usage has been trending.
Historic usage can also be utilized in forecasting. There are several different forecasting methods, such as using the average requests per month to forecast for the year by drawing on either Unique Item Requests or Total Item Requests from COUNTER 5 statistics.
For example, if a certain journal had 900 Total Item Requests for January through June of this year, then the average requests each month is 150 Total Item Requests. To calculate what usage should look like for the entire year, that amount can be multiplied by 12 months, which equals 1,800 Total Item Requests forecasted for the entire year.
While the above example uses only 6 months to calculate an average, there is the option to incorporate a longer time span, leveraging usage data over the past 12 months or more to calculate the monthly average. In addition, using an analytics tool, like RightFind Business Intelligence from CCC, to factor in seasonal trends can also provide more precision in your forecasting.
Once a forecast has been obtained, comparing it against actual historical usage side-by-side with a year-over-year visualization can paint a more complete picture of usage to justify budget to internal decision makers:
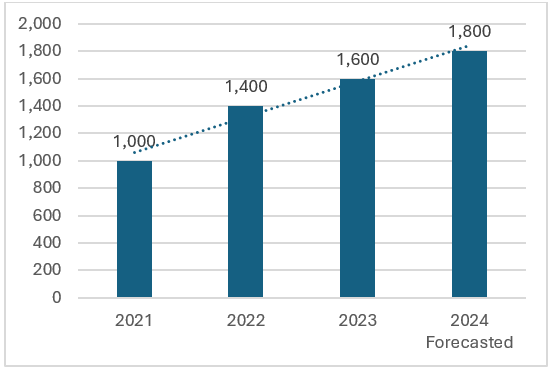
To justify the cost of a subscription for a publication being heavily used, you can even go a step further and calculate the equivalent document delivery cost. If, say, a publication is forecasted to have 1,800 Total Item Requests in 2024, and the average cost of that content is $70 per article, then that could cost upwards of $126,000 for the year if every request was to incur a fee. Of course, it’s entirely possible that not every request would have a fee associated, but even a fraction of that forecasted equivalent document delivery cost might be more than the value you receive from an organization-wide subscription.
As senior leadership looks to information managers to justify spend, having hard data presented in clear visualizations will make a strong case for keeping your content portfolio in place.
Conversely, while using visualizations can tell a story of what content your researchers need most, the data can also provide insight into any research areas of focus that may have changed. At renewal season, it may be possible to add titles that align with your researchers’ changing content needs, and if multiple items are subscribed to from a publisher, then creating a tree map of usage by publication is another way to see what content is being used more heavily than others: 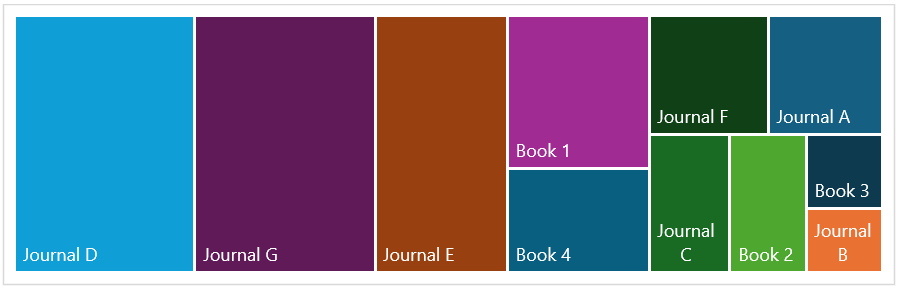 COUNTER usage may be helpful as well in determining where a subscription may be needed that isn’t currently in place. That information can be found in reports such as the TR_J2 report (Journal Access Denied), TR_B2 report (Book Access Denied), and the TR report (Title Master) by looking at usage with a Metric Type of No License. In those instances, publications were attempted to be requested but the user encountered a paywall due to not having subscribed access (also known as “turn-aways”). Further investigation can be performed by looking into a document delivery order report to validate whether orders were then placed for that content.
Where to Find Usage Data and What to Look For?
Subscription utilization is typically captured in COUNTER 5 usage reports. For most publishers, that usage data can be found right in the publisher’s admin portal, often in a section of the site dedicated to usage analytics, and it’s exportable to Excel. There are multiple report types available in the COUNTER 5 code of practice, but the TR_J1eport is often used for a complete view of journal subscription usage for controlled titles only (open access and free-to-read usage is excluded).
Book report-controlled usage can be found in the TR_B1 report. Alternatively, the TR – Title Master report may be used for full details on usage of both journals and ebooks, including accesses with No License. Remember that the Title Master will include OA Gold requests, but that can be excluded in the Access Type filtering.
Want to see all your organization’s content usage aggregated in one place and powering rich data visualizations? Manually gathering, normalizing, and analyzing subscription usage data is time-consuming, but RightFind Business Intelligence gives you a complete enterprise view of content use in seconds, including granular details on usage through RightFind, your organization’s source systems, and COUNTER statistics across publisher platforms via SUSHI.
RightFind Business Intelligence is the only solution to combine analytical tools for insights on content usage and spending with budget tools to help you justify your content investment. Make spreadsheets and pivot tables a thing of the past when reporting your organization’s content usage and spend. With RightFind Business Intelligence, you can organize and share the data most valuable to you and your colleagues through customizable dashboards.
RightFind Business Intelligence may be used in conjunction with RightFind Enterprise or as a standalone analytics platform. Visit our RightFind Business Intelligence page now to learn more about the many features and benefits of this CCC analytics solution.